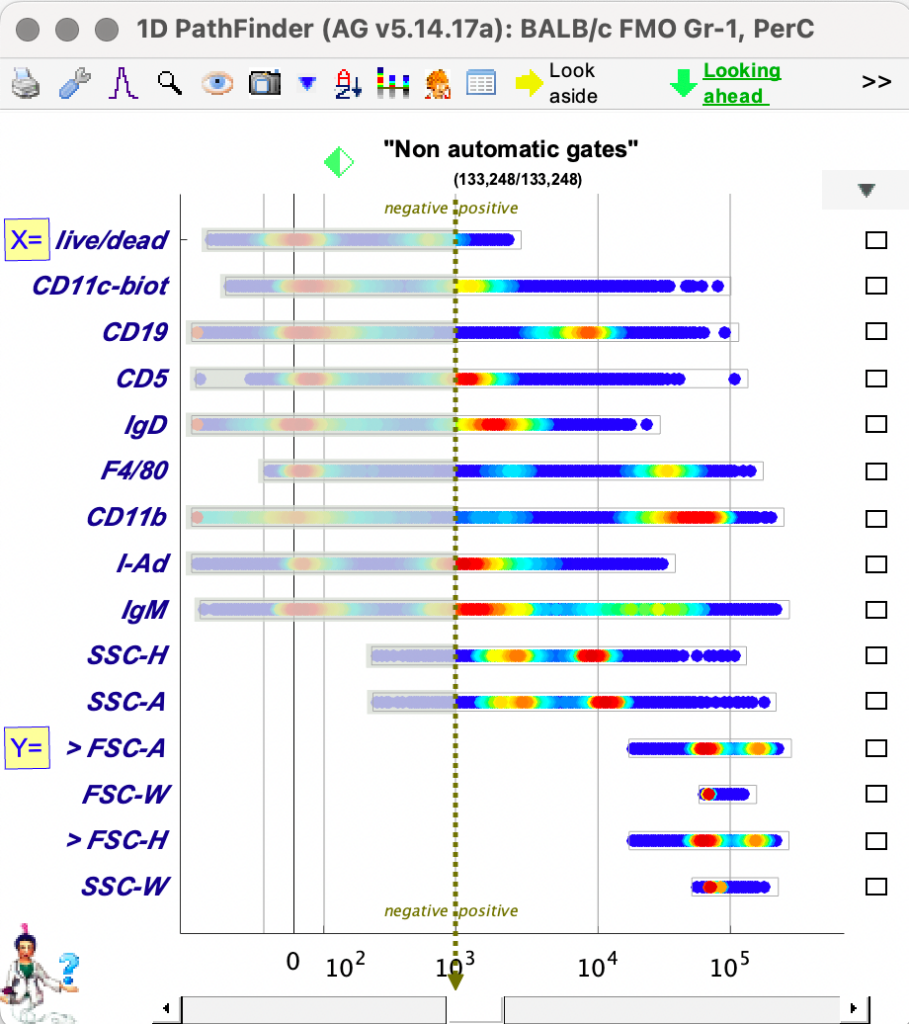
The 1D PathFinder window;
- Associates with a specific plot editor window
- Shows the staining on all parameters for selected cells or for all cells in the associated plot editor window.
- Depicts each parameter with a horizontal bar that uses pseudo color’s convention of showing where staining occurs most.
- Uses a vertical red dashed line to indicate a user definable threshold for positive
- Uses bold font for labels of parameters unused in the current gating sequence and normal font with a “>” prefix for labels of parameters used in the current gating sequence.
To access 1D PathFinder anytime, click on the icon indicated in the below window.
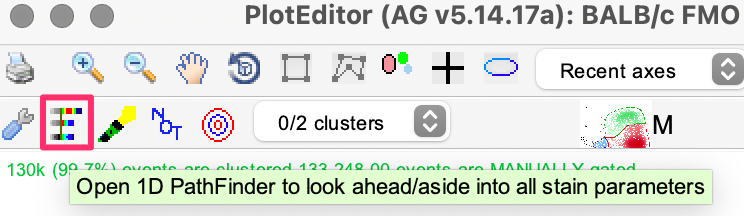
It then opens up the 1D PathFinder window.
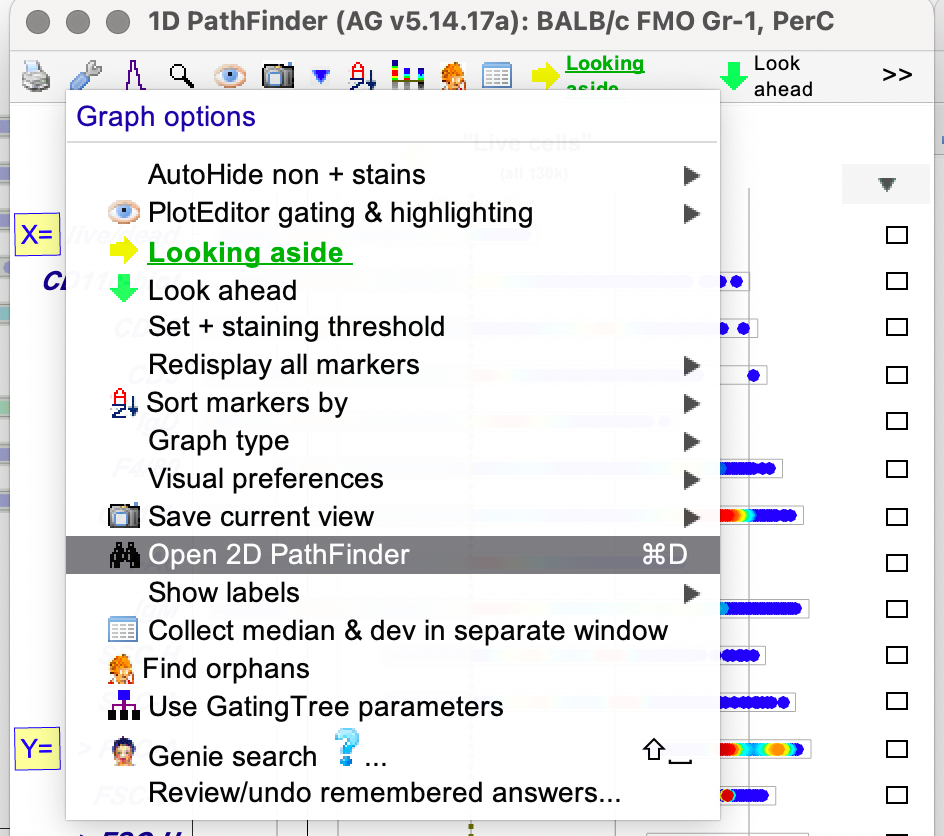
To view the 2D PathFinder, click Edit > Open 2D PathFinder
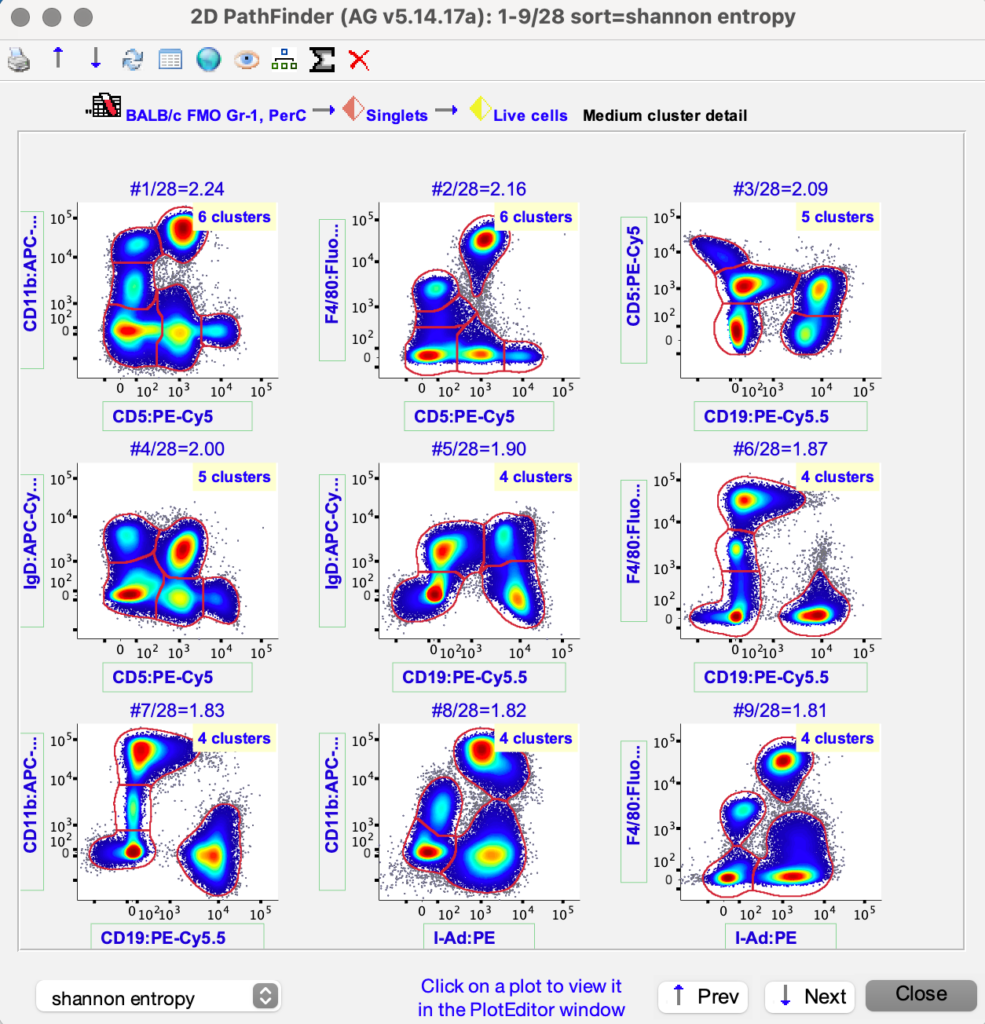
Change / Confirm the preferences
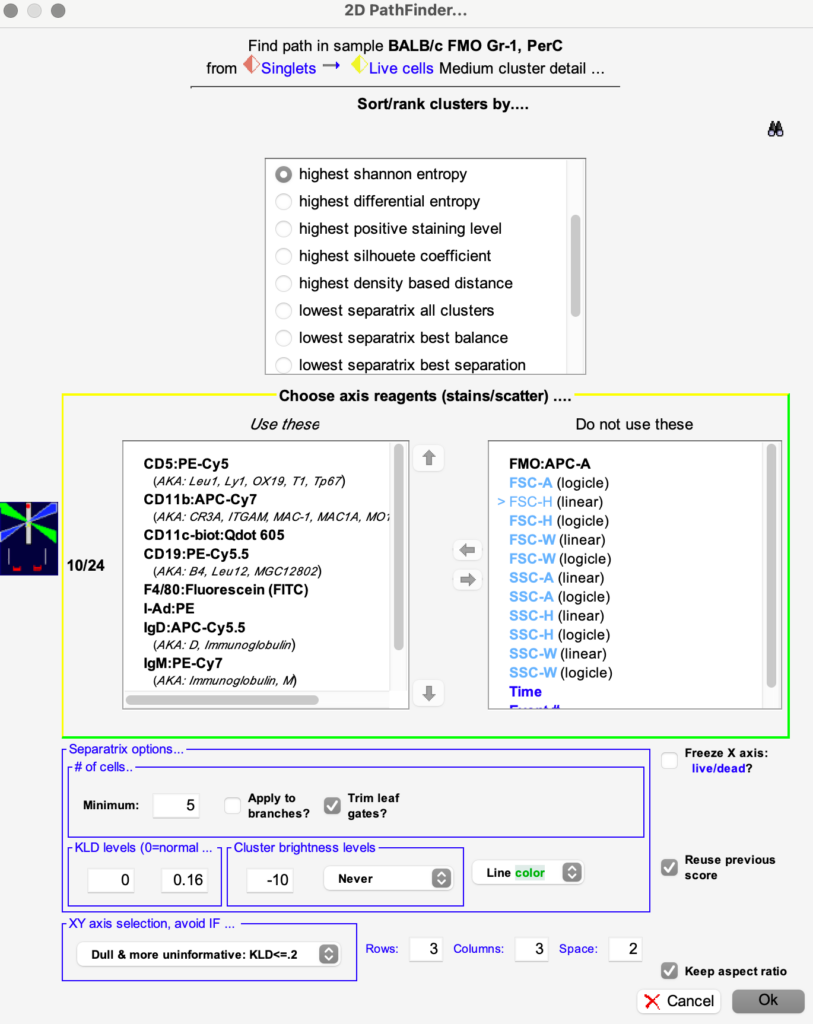
It then opens the 2D PathFinder, as below