AutoGate gives you the tools to design the way your plot graphs look — their colors, clusters, contours, gates, grids, and parameters. Design it all in no time with just a few clicks of your mouse.
Go to the upper right hand corner of the graph and click See Preferences. Your options will appear to the right side of the window.
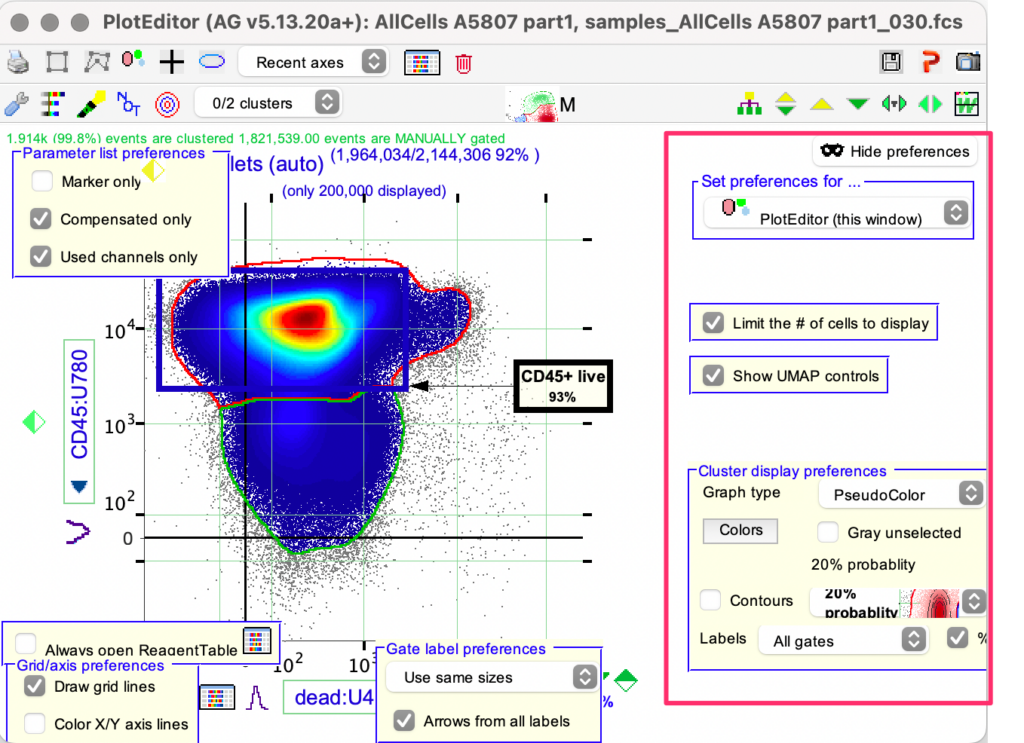
As you can see, most of the settings are self explanatory. Below are some of the frequently used preferences.
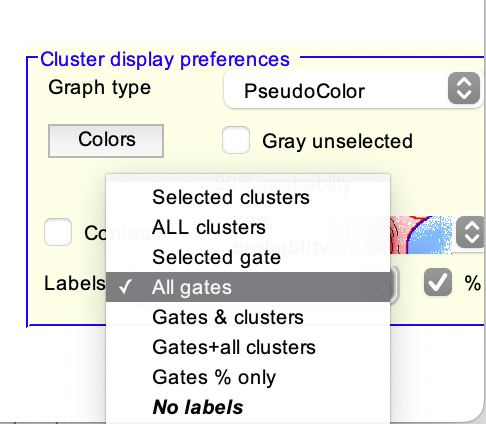
1. To view the labels for the clusters and or gates, click on the Lables drop down and select the required option
also, select the Arrow from all labels check box
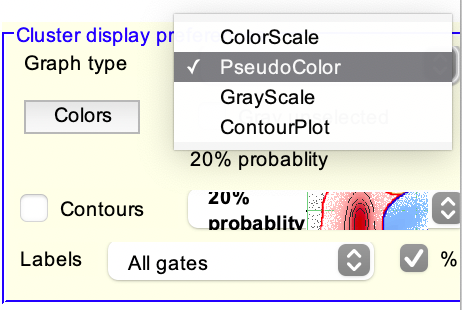
2. You can also change the default graph type, as below.
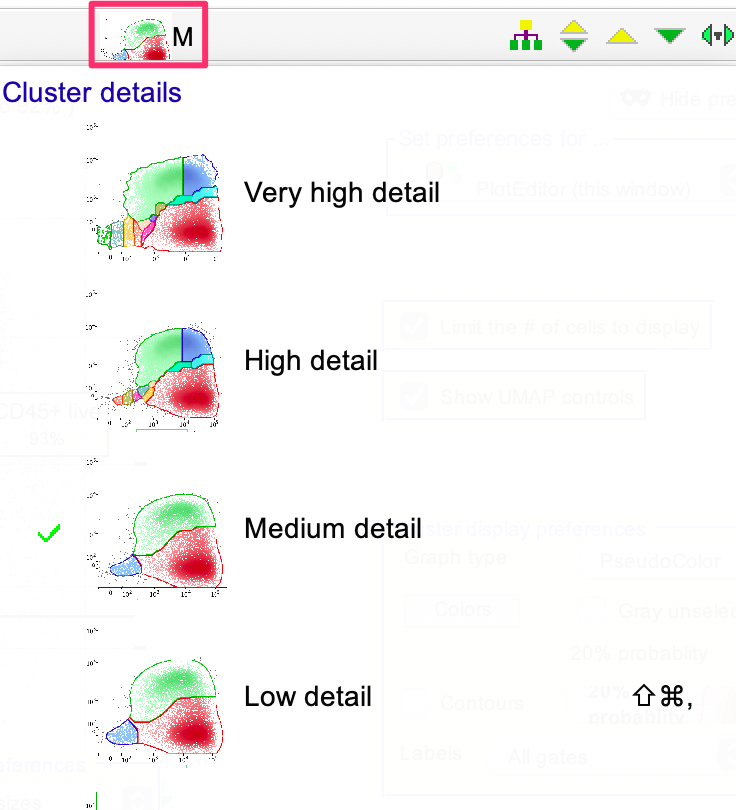
3. To change the level of cluster detail, click on the Cluster details icon on the toolbar, as indicated below
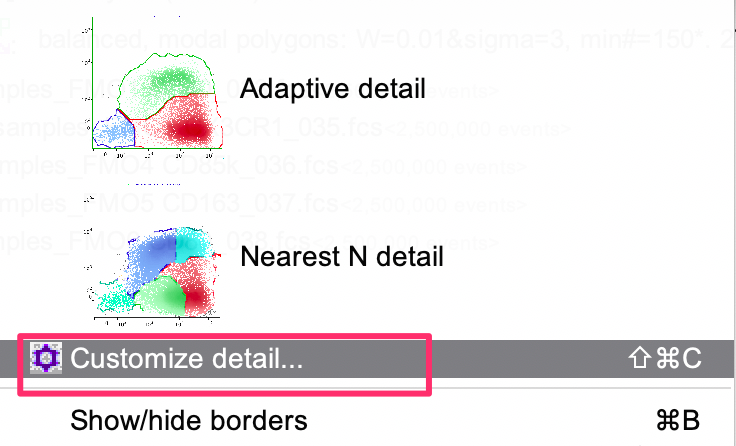
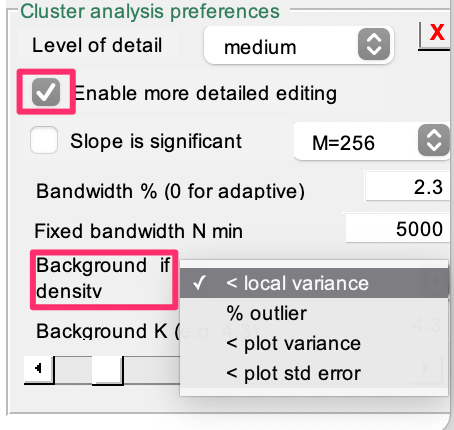
4. To set/change the % of outlier, choose Customize detail from the cluster details
Select Enable more detailed editing checkbox and choose % outlier from the Background if density drop down
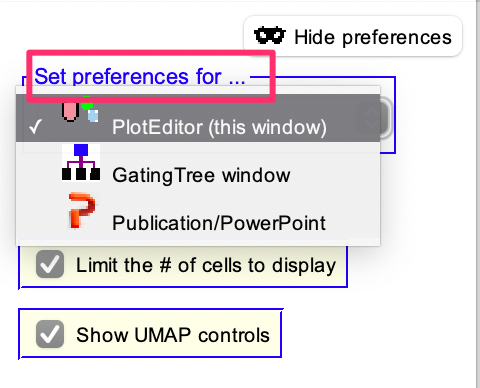
5. You can also control the characteristics of Gating tree and Publication output by choosing from the Set preferences for… drop down, as highlighted below