AutoGate uses our statistically rigorous Density-Based Merging (DBM) to plot the subsets and their subsets in your samples. AutoGate’s cluster analysis is based on this publication. The plotting is automated. It is statistically correct to an unmatched degree. And you can use it to create gating models to apply to other experiments.
Our software gives you different ways to do what you want to do and a massive amount of useful information to help you do it. Give yourself time to take everything in.
To view the plots, double click on the baseline sample in the gating tree.
AutoGate responds by :
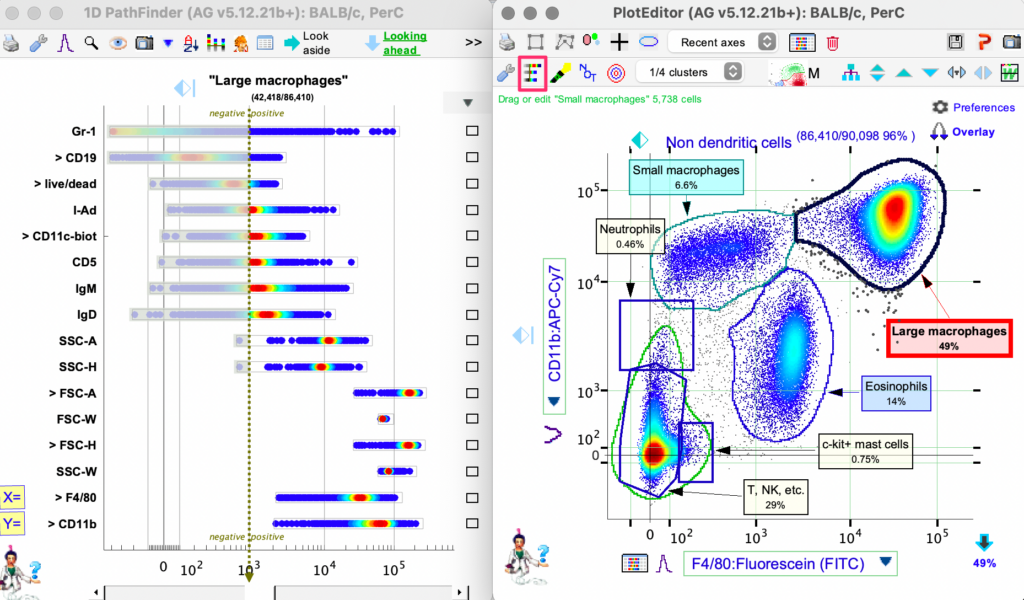
- Opening the plot editor window and the path finder window.
- Computing the bi-exponential’s W (width) parameter to set the logicle/linear region of the scale as accurately as possible. It does this by analyzing EVERY sample which uses the same compensation matrix. This only happens the first time that AutoGate opens a sample for each compensation matrix in an experiment.
- Setting the X and Y axis to defaults automatically found during experiment setup
- Clustering the data for all of the sample’s cells and the X and Y markers
- Showing each cluster by a different color
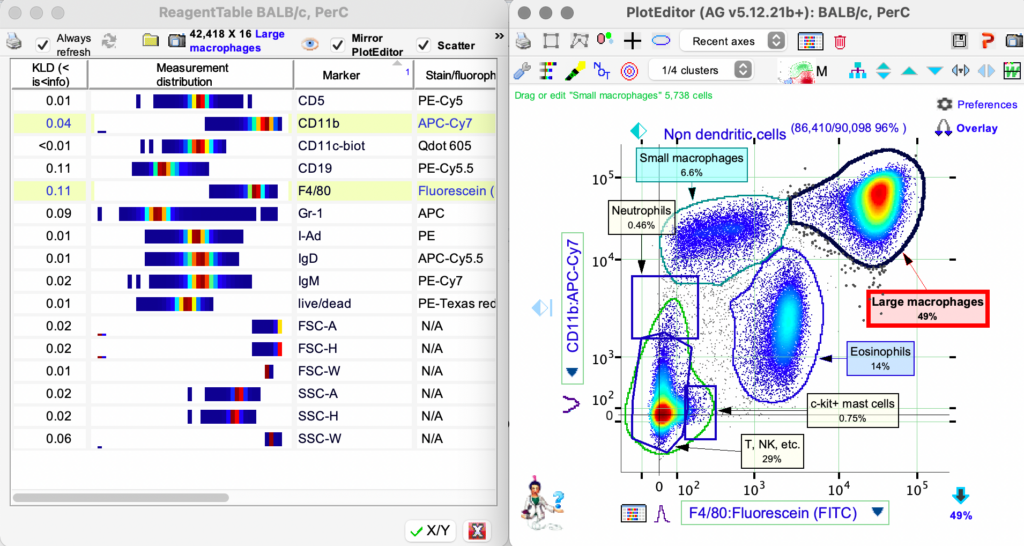
Pathfinder helps to look aside/ahead into all stain parameters
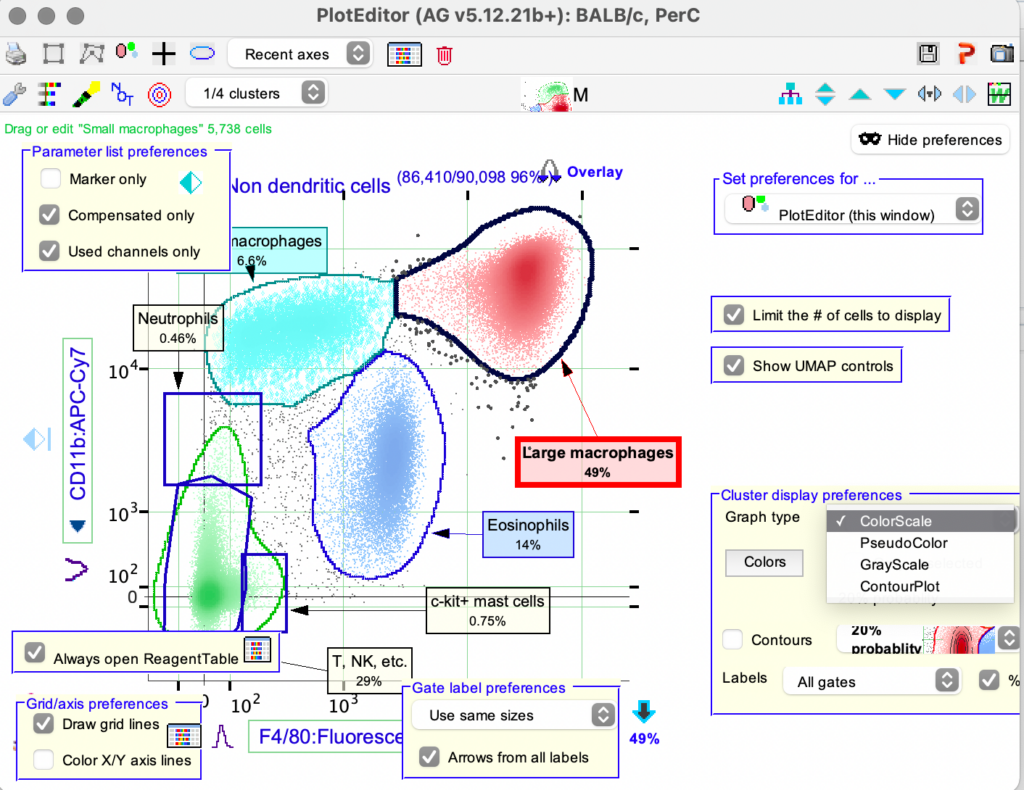
To change graph type or alter probability contour lines, click Preferences.