
The below screen lets you pre-define the X/Y axis display for the gating plots . Double click on the axis column and choose the reagent from the drop down
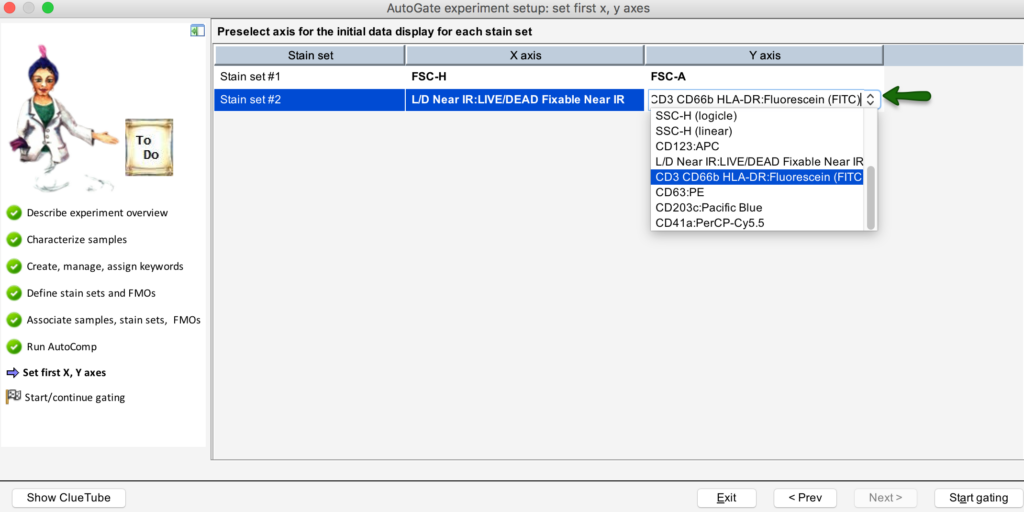
You are now set to run AutoGating. Click Start gating
The below screen lets you pre-define the X/Y axis display for the gating plots . Double click on the axis column and choose the reagent from the drop down
You are now set to run AutoGating. Click Start gating