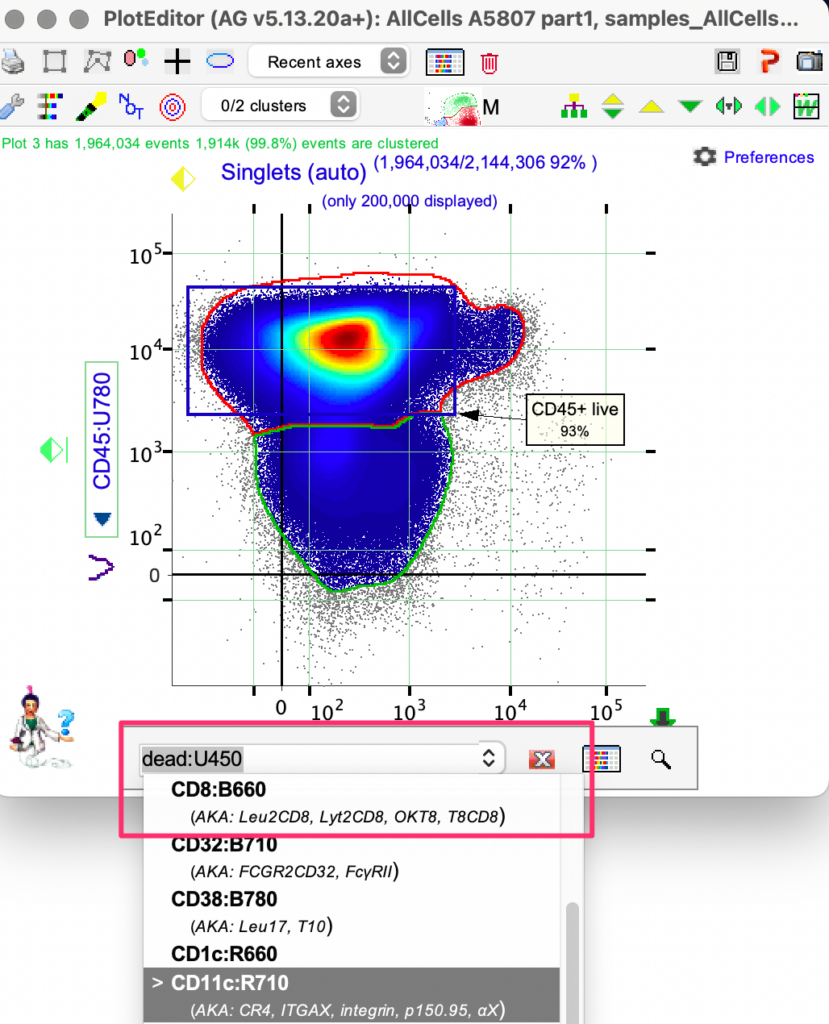
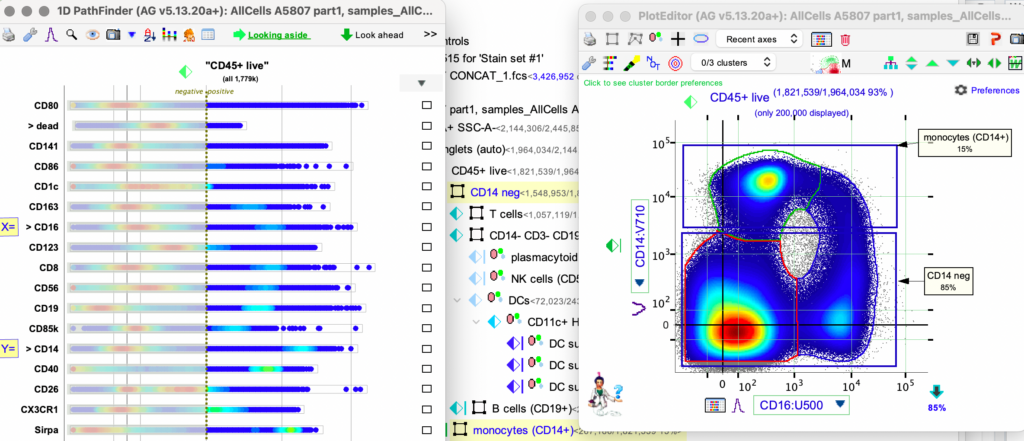
Ensure the appropriate X and Y axis are set.
To set the axes you click on the down arrow button next to the X and the Y axis labels to activate a drop down of choices.
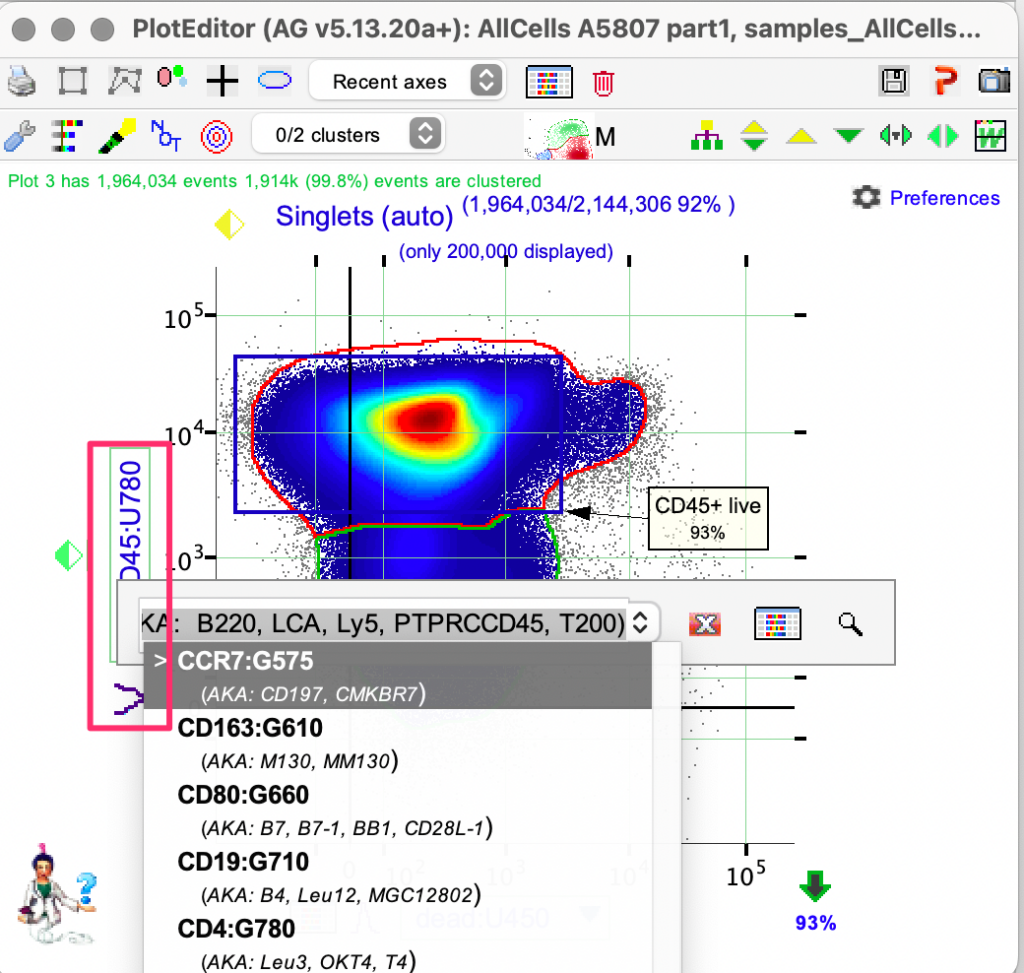
To change Y axis;
Select the clusters either by;
- Clicking on the cluster
- Choosing from the cluster drop down from the tool bar
AutoGate responds by;
- Drawing a black border around the green cluster to signify user’s selection.
Select other clusters, as required.
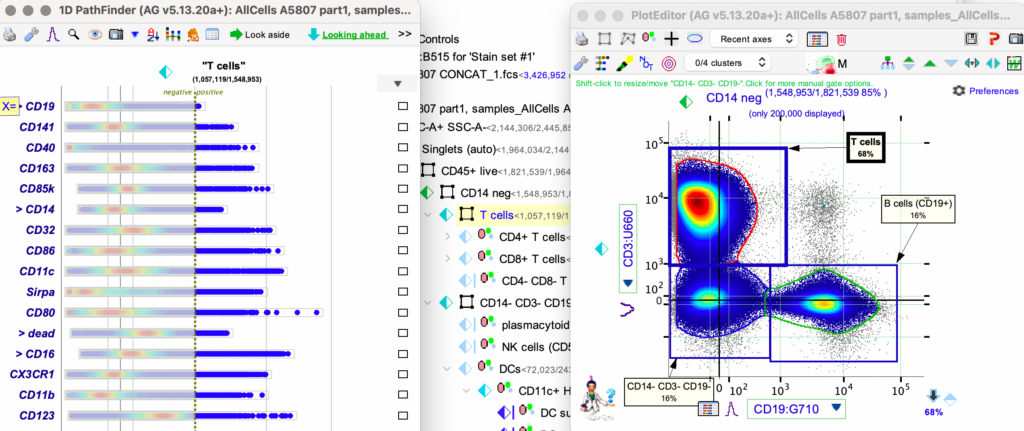
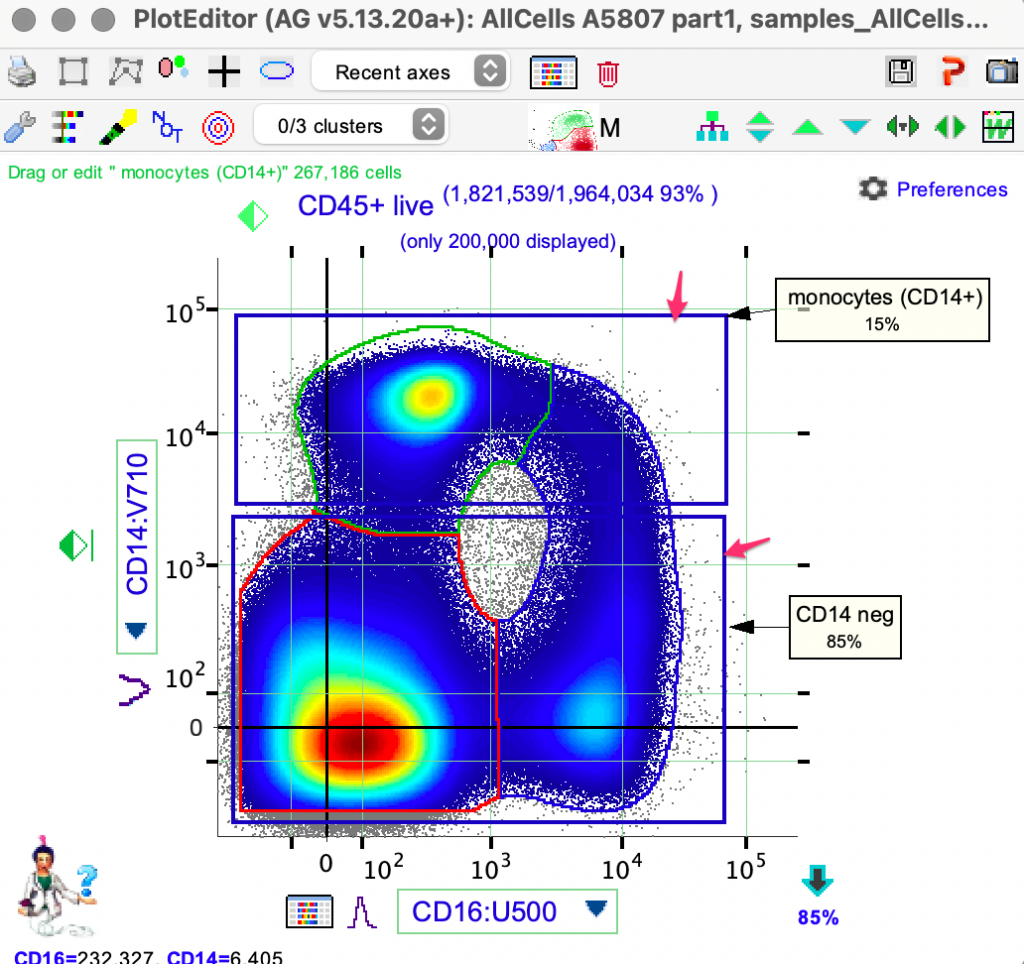
Once you specify the name and click OK, AutoGate responds by restricting the plot window to ONLY the cells/events within your chosen cluster.
You will also notice that the created gate is reflected in the Path finder and Gating tree.
To create sub gates, use the same actions for the above gate(s)